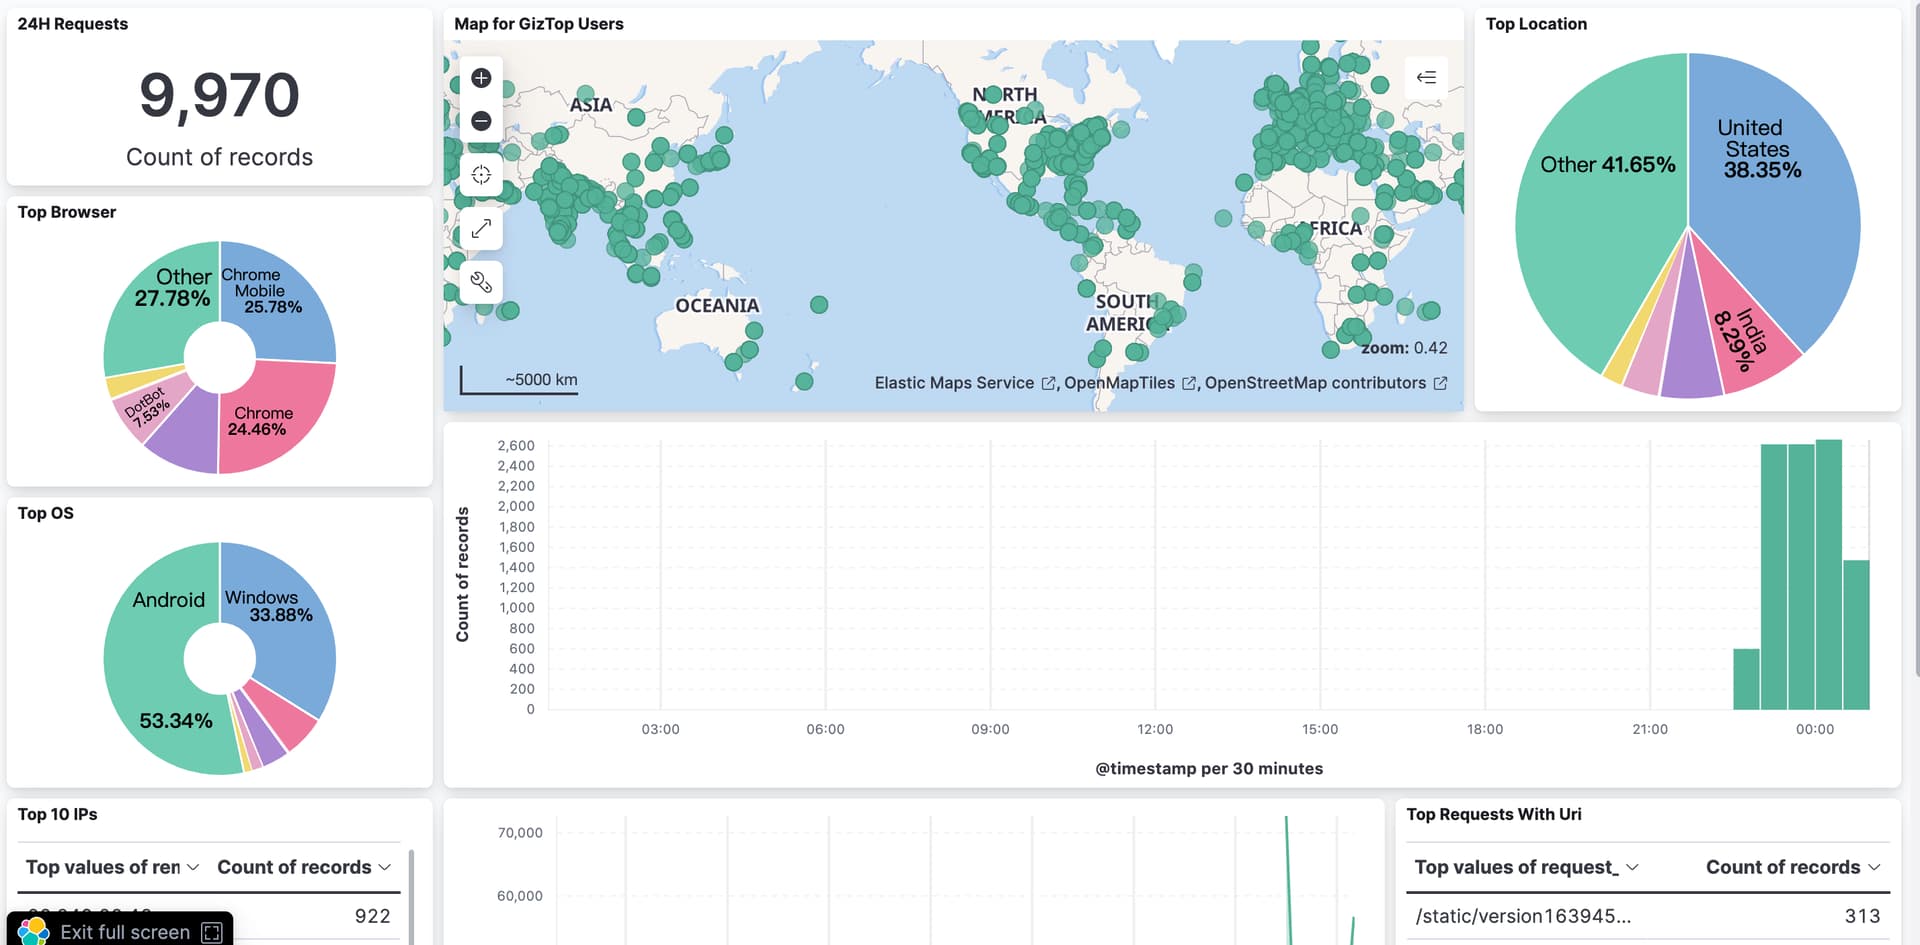
简易可视化效果图
前言
Magento 2.3 之后就默认依赖了 elasticsearch
elastic stack 是非常强大的一款日志及搜索平台,如果仅仅用来跑Magento的搜索是很不划算的
在这里我教大家如何把nginx json格式的日志,直接打到ES里,并用Kibana进行可视化分析
市面上的教程基本上是通过了logstash进行的,我搜索了一整天的资料和观看官方文档,终于解决了filebeat直接打数据到ES的问题,在这里给大家做个分享。
Why Json
ELK套件实际是是可以直接分析Nginx的原始日志的,但是json除了更利于人观看之外,更多的是我对nginx的原始日志不太满意,做了更多的定制化在内,比如XFF,POST参数(因nginx默认不支持,这里不多做介绍)等等
Nginx日志的生命周期
Nginx → Nginx Json Logs → filebeat(采集) → pipeline(清洗) → elasticsearch(存储) → Kibana(可视化)
开始配置
第一步: Nginx
首先编辑Nginx的nginx.conf文件, 增加Nginx日志的Json格式到http块:
  log_format json escape=json '{"@timestamp":"$time_iso8601",'
                      '"server_addr":"$server_addr",'
                      '"remote_addr":"$http_x_forwarded_for",'
                      '"scheme":"$scheme",'
                      '"request_method":"$request_method",'
                      '"request_uri": "$request_uri",'
                      '"request_length": "$request_length",'
                      '"uri": "$uri", '
                      '"request_time":$request_time,'
                      '"body_bytes_sent":$body_bytes_sent,'
                      '"bytes_sent":$bytes_sent,'
                      '"status":"$status",'
                      '"upstream_time":"$upstream_response_time",'
                      '"upstream_host":"$upstream_addr",'
                      '"upstream_status":"$upstream_status",'
                      '"host":"$host",'
                      '"http_referer":"$http_referer",'
                      '"http_user_agent":"$http_user_agent"'
                      '}';
这里有个坑,配置完了之后不是马上生效,需要在对应的vhost log的配置里把 json 这个字符串加进去,这样才会按照 json 这个格式进行记录
Example:
access_log /var/log/nginx/magentochina.org-access.log json;
编辑完nginx配置文件之后, 可以需要先reload或者restartnginx,然后尝试 tail 一下nginx的日志,是否生效
第二步: pipeline
需要在es上新建一个pipeline, 配置文件如下:
PUT _ingest/pipeline/nginx_json_logs_transfor
{
  "description": "Pipeline for parsing Nginx access logs. Requires the geoip and user_agent plugins.",
  "processors": [
    {
      "set": {
        "field": "event.ingested",
        "value": "{{_ingest.timestamp}}"
      }
    },
    {
    "remove": {
        "field": "ecs"
      }
    },
    {
      "set": {
        "copy_from": "@timestamp",
        "field": "event.created"
      }
    },
    {
      "user_agent": {
        "field": "http_user_agent",
        "ignore_missing": true
      }
    },
    {
      "geoip": {
        "field": "remote_addr",
        "target_field": "source.geo",
        "ignore_missing": true
      }
    },
    {
      "geoip": {
        "database_file": "GeoLite2-ASN.mmdb",
        "field": "remote_addr",
        "target_field": "source.as",
        "properties": [
          "asn",
          "organization_name"
        ],
        "ignore_missing": true
      }
    },
    {
      "rename": {
        "field": "source.as.asn",
        "target_field": "source.as.number",
        "ignore_missing": true
      }
    },
    {
      "set": {
        "field": "event.kind",
        "value": "event"
      }
    },
    {
      "append": {
        "field": "event.category",
        "value": "web"
      }
    },
    {
      "append": {
        "field": "event.type",
        "value": "access"
      }
    }
  ],
  "on_failure": [
    {
      "set": {
        "field": "error.message",
        "value": "{{ _ingest.on_failure_message }}"
      }
    }
  ]
}
第三步: filebeat配置
配置filebeat读取nginx文件
filebeat.inputs:

# Each - is an input. Most options can be set at the input level, so
# you can use different inputs for various configurations.
# Below are the input specific configurations.

- type: log

  # Change to true to enable this input configuration.
  enabled: true

  # Paths that should be crawled and fetched. Glob based paths.
  paths:
    - /var/log/nginx/magentochina.com-access.log
#    - /var/log/nginx/access.log
    #- c:\programdata\elasticsearch\logs\*
  fields:
     log_source: nginx
     log_type: www
     index: nginx
  fields_under_root: true
  tags: ["nginx","magentochina"]
  json:
    keys_under_root: true
    overwrite_keys: true
以上的配置是告诉filebeat log文件在哪里,并且把日志按json格式进行处理
配置Kibana和Elasticsearch
setup.kibana:

  # Kibana Host
  # Scheme and port can be left out and will be set to the default (http and 5601)
  # In case you specify and additional path, the scheme is required: http://localhost:5601/path
  # IPv6 addresses should always be defined as: https://[2001:db8::1]:5601
  host: "10.108.0.7:5601"
  # 这填写自己的Kibana service地址

# ---------------------------- Elasticsearch Output ----------------------------
output.elasticsearch:
  # Array of hosts to connect to.
  hosts: ["10.108.0.7:9200"]
  pipeline: "nginx_json_logs_transfor"
  indices:
    - index: "magento-nginx-%{+yyyy.MM.dd}"
      when.equals:
        fields:
          index: "nginx"
第四步: 配置Kibana
配置索引数据
配置可视化
注意
- 注意: 不要打开filebeat的nginx modules模块,那是为默认nginx日志服务的
- 最好不要把
Magento 搜索索引和日志放在一个库 - 这是一个轻量化方案,日志比较多的情况下请多研究一下
- 不要在生产环境上直接操作,先测试好
- 部分内容空了再来补